The Florida Dairy Business
Volume 3 Issue 7
July 1998
Milk Prices
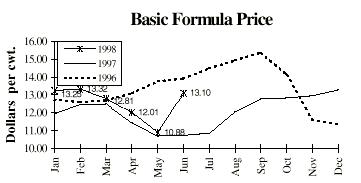
The June Basic Formula Price (BFP) jumped $2.22, as expected. The impact will be felt in August mailbox milk prices in Florida. Forecasts call for further increases with the July BFP over $14.00. Forecasts are for the BFP to peak this summer somewhere in the $14.00 - 15.00 range, depending on weather.
|
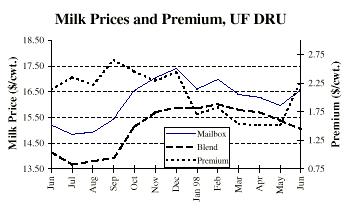 |
The table below shows the expected jump in Class I prices in August. With the premium remaining fairly steady, most of the increase will be realized in mailbox milk prices. Note the increase of the June premium in the graph above. This increase in premium caused an increase in the DRU mailbox milk price for June, reversing a decline since December, 1997.
 |
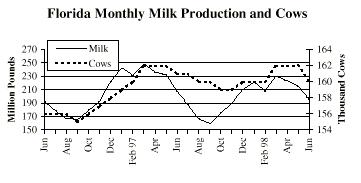
Cattle numbers in Florida are down for the first time since October, 1997. See graph below.
 |
Class I Milk Prices and Net Premiums* |
||||||
Jun 98 |
Jul 98 |
Aug 98 |
||||
| Location | Class I |
Premium |
Class I |
Premium |
Class I |
Premium |
| Atlanta | 16.39 |
1.30 |
15.26 |
1.30 |
17.48 |
1.30 |
| Up. FL | 17.51 |
1.92 |
16.68 |
2.22 |
18.85 |
2.17 |
| Tampa | 18.21 |
2.32 |
17.38 |
2.62 |
19.55 |
2.57 |
| Miami | 18.91 |
2.72 |
18.08 |
3.02 |
20.25 |
2.97 |
*
Announced
Other Benchmarks
Genske, Mulder & Co. are Certified Public Accountants who work with dairies throughout the US. They have provided us with 1997 year end data, which we show below. We are presenting it along with Florida Dairy Business Analysis Program (DBAP) data on the facing page (p. 3) for comparison.
Note that heifer feed and raising costs have been subtracted out, so add these back in to get comparable numbers. Like the DBAP averages, these are not averages for the state but are a sample, reflecting the firm’s clientele.
You might consider the mailbox milk prices on page 3 in relation to these numbers, and their comparison to the Florida numbers also on p. 3.
Average income and expenses per cwt. for dairy clients, Genske, Mulder & Co. for year ended December 31, 1997 |
||||||
| INCOME Milk Calves Patronage dividend Other Total income EXPENSES Feed Hay and silage Grain Less cost of feeding heifers Total feed costs Herd replacement cost Depreciation - dairy cows Loss on sale of cows Total herd replacement costs Other operating expenses Labor Depreciation, other Milk hauling Promotion Federal assessment Supplies Corral cleaning Repairs and maintenance Utilities Taxes and licenses Insurance Fuel and oil Legal and accounting Employee benefits Veterinary and breeding Testing and trimming Hauling livestock Miscellaneous Less cost of raising heifers Total other expenses Total expenses Income before financing costs Interest and rent expense Net income Average number of cows Average daily milk per cow |
Arizona $13.25 .07 .23 .02 $13.57
2.78 4.53 (0.44) 6.87 .80 .42 1.22 1.08 .35 .54 .42 .50 .05 .33 .33 .15 .12 .07 .05 .01 .08 .09 .03 .01 (.11) 4.10 12.19 1.38 .89 .49 1,317 62 |
California 12.67 .10 .17 .07 13.01
3.50 4.48 (1.17) 6.81 .81 .58 1.39 1.01 .22 .26 .20 .49 .04 .35 .23 .13 .10 .07 .05 .07 .17 .07 .01 .01 (.26) 3.61 11.81 1.62 1.00 .62 1,154 63 |
Idaho 12.38 .05 .01 .04 12.48
3.00 4.03 (1.62) 5.41 .84 .77 1.61 1.19 .37 .18 .17 .60 .13 .24 .17 .18 .09 .09 .04 .05 .27 .09 .01 .03 (.22) 3.68 10.70 1.78 .98 .80 1,232 62 |
Washington 12.77 .09 .06 .04 12.96
3.20 4.16 (0.91) 6.45 .67 .62 1.29 1.07 .39 .51 .20 .70 .03 ..42 .14 .17 .07 .07 .05 .02 .20 .06 .02 .01 (.08) 4.05 11.79 1.17 .80 .37 1,448 78 |
New Mexico 12.70 .11 .05 .02 12.88
2.69 5.07 (1.16) 6.60 .82 .72 1.54 1.20 .32 .39 .17 .50 .03 .31 .22 .17 .07 .08 .04 .03 .26 .03 .02 .03 (.29) 3.58 11.72 1.16 .71 .45 1,373 65 |
Central Texas 13.89 .17 .05 .05 14.16
2.36 5.61 (.83) 7.14 .92 .72 1.64 1.07 .59 .52 .17 .58 .04 .39 .31 .18 .10 .10 .07 .09 .19 .06 .04 .04 (.21) 4.33 13.11 1.05 1.12 .07 926 61 |
1998 Dairy Production Conference Proceedings
There are some extra copies of the proceedings available. If you did not receive a copy and wish to, please contact Jack Van Horn. Address, phone, fax or e-mail are:
H. H. (Jack) Van Horn
Dairy & Poultry Sciences Dept.
University of Florida
P.O. Box 110920
Gainesville, FL 32611-0920
Phone: 352/392-5594
Fax: 352/392-5595
e-mail: vanhorn@animal.ufl.edu
1997 Dairy Business
Analysis Project
Summary
The table on the right lists 1997 summary information from dairies participating in the Dairy Business Analysis Project (DBAP). To date, 45 dairies from Florida, Georgia, and Alabama are participating in DBAP. This 1997 information was summarized from 27 dairies providing complete and verifiable financial information. Dairies were also examined for unusual circumstances such as herd expansion which might distort the summary. Overall, 32 dairies provided complete information, a large increase from 11 in 1995 and 18 in 1996.
As the table shows, 1997 was, on average, a slightly profitable year with a net farm income per cwt. milk sold of $0.32. Please keep in mind some assumptions when interpreting this information. All revenues and expenses were accrual adjusted for changes in inventory, accounts payable, and prepaid expenses. Depreciation for livestock was included if capitalized livestock could be separated from those expensed or raised. Otherwise, all livestock purchases were expensed and were categorized under expensed replacements. Machinery and building depreciation was taken from tax records. Balance sheet data are based on market values.
Currently, we are producing reports for dairies participating in DBAP with delivery scheduled to occur throughout August. These reports provide a number of comparisons for the operating, financing, and investing activities of the business, including benchmarks of the top DBAP dairies. Participants will be able to directly compare their performance to the summary information listed here. It is not too late to join DBAP. To find out more, contact your dairy extension agent or me, the new DBAP manager.
-Marvin Hoekema
Florida Dairy Business Analysis Program 1997 Financial Data (per cwt. milk sold) |
||
Average |
Top 25%* |
|
| REVENUES Milk sales Cow sales Calf/heifer sales Other livestock Crops Other Total COSTS Personnel Purchased feed Crops Machinery Livestock (including replacements) Milk marketing Real estate Interest Depreciation Other Total NET FARM INCOME FROM OPERATIONS Assets per cow Total cows Cows per worker Milk sold per cow Milk sold per worker Liabilities per cow Rate of return on assets Operating profit margin Asset turnover ratio |
16.87 0.78 0.11 0.08 0.17 0.28 18.30 2.45 8.37 0.33 0.85 2.39 1.06 0.50 0.68 0.64 0.71 17.98 0.32 4,161 1,502 53 17,014 885,200 1,487 0.03 0.02 0.87 |
17.17 1.01 -0.02 0.18 0.90 0.53 19.77 2.34 8.40 0.55 0.83 2.13 0.96 0.56 0.66 0.63 0.58 17.63 2.14 3,991 1,428 56 17,053 950,772 1,331 0.09 0.11 0.94 |
| *Top 25% of DBAP dairies based on net farm income. |
Considering the 2x Option for the Summer?
Several dairy producers with 3x milking schedules have discussed dropping to 2x for the summer months. The unknown is whether summer production is so constrained by the environment that response to 3x is reduced and may be less profitable considering the cost of additional inputs. Here is a summary of my thoughts.
Conclusions:
Results of analyzing DBAP data (which I did) were not clear. Managers are encouraged to do their own calculations based on their circumstances and best assumptions. DBAP participants have an advantage since their past costs per cwt. are known.
A close look at the days in milk of groups of cows is probably a good first step. If you have a group of cows with low days in milk, it may be most profitable to keep those cows on 3x and drop the rest of the herd to 2x.
Assumptions and results are dependant upon your ability to keep cows comfortable and nutrition at a profitable level. Uncomfortable cows with reduced feed intake are probably not responding to 3x milking anyway.
With this group of assumptions, it would seem prudent to drop to 2x milking during the summer or until a sizeable group of cows begin to freshen.
-Russ Giesy
Mailbox Milk Prices |
|||
| Location | Apr 97 |
Apr 98 |
Dif From Florida |
| Florida1 Southeast Mid-Atlantic New England2 Upper Midwest Texas NM - West Texas |
13.45 13.98 13.02 12.99 12.39 12.69 11.94 |
16.22 14.54 14.06 13.78 13.14 13.39 12.37 |
0 -1.68 -2.16 -2.44 -3.08 -2.83 -3.85 |
| 1Three order weighted average 2 Includes effect of NE Compact |
|||
Florida Dairy Extension
| Andy Andreasen - Jackson Co. | Wayne Odegaard - Hernando Co. |
| David Bray - Dairy & Poultry Sci. | Travis Seawright - Manatee Co. |
| Michael DeLorenzo - Dairy & Poultry Sci. | David Shannon - Calhoun Co. |
| Roger Elliott - Escambia Co. | David Solger - Washington Co. |
| Shepard Eubanks - Holmes Co. | Mary Sowerby - Multi-county |
| Russ Giesy - Multi-county | Charles Staples - Dairy & Poultry Sci. |
| Mary Beth Hall - Dairy & Poultry Sci. | Robert Tervola - Suwannee Co. |
| Larry Halsey - Jefferson Co. | Paulette Tomlinson - Columbia Co. |
| Pat Hogue - Highlands Co. | James Umphrey - Dairy & Poultry Sci. |
| Patrick Joyce - Duval Co. | Jack Van Horn - Dairy & Poultry Sci. |
| Elzy Lord - Alachua Co. | Chris Vann - Lafayette Co. |
| Pat Miller - Okeechobee Co. | Marvin Weaver - Gilchrist Co. |
| Roger Natzke - Dairy & Poultry Sci. | Dan Webb - Dairy & Poultry Sci. |
The Florida Dairy Business newsletter is published on a monthly basis by the University of Florida, Dairy and Poultry Sciences Department as an educational and informational service. Please address any questions, comments or suggestions to Michael DeLorenzo, Editor, The Florida Dairy Business, P O Box 110920, Gainesville, FL 32611-0920. Ph: (352) 392-5594.