The Florida Dairy Business
Volume 2 Issue 6
October 1997
Milk Prices and
1997 Profits Picture
The September mailbox milk price was up $.51. The price will continue to climb for the next two months, because the Basic Formula Price (BFP) rose through August and September. The effect of these increases in the BFP and the announced premiums on Class I prices through November are shown in the table at the bottom right of this page. The Class I price is based on the BFP from two months earlier.
|
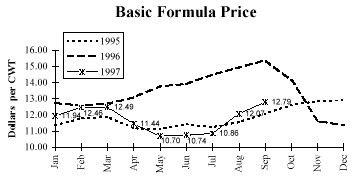
How well off are we so far in 1997? What does this tell us about how much tighter margins could be in 1997 compared to 1996? We could compare the first three quarters of 1997 to 1996, but remember that we had historically high milk prices in 1996, particularly in the second half of the year. You can see from the Basic Formula Price graph on this page that this underlying price mover (the BFP) in 1997 is more similar to 1995. So let’s use 1995 as the basis for comparison. How were things in 1995? The dairies participating in the Dairy Business Analysis Project basically averaged no profit in 1995, and returns to assets were slightly negative – but essentially zero.
Let’s look at milk prices first, then feed costs, then put the two together. For the first 9 months of 1997 the BFP has averaged $11.72, while in 1995 it averaged $11.51.
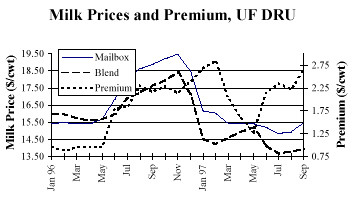 |
The blend price has averaged $14.34 in 1997, for the same period in 1995 it averaged $14.60. How about mailbox milk prices? In 1997 the mailbox price received by the Dairy Research Unit at UF has averaged $15.44, but for the same period in 1995 it was $13.65. How could it be so much higher ($1.79) when the BFP and blend were basically the same for the two years?
The answer is the "premium." We have talked about what the premium is in this newsletter in the past. For 1997, the premium has averaged $2.20 for the first nine months. For the same period in 1995 the premium averaged $.40, a difference of $1.80 (a lot of additional money paid to Florida dairymen). The premium is negotiated monthly between coop representatives and the coop’s customers. In practice it has an upper limit, set by Class I prices and premiums north of Florida, and this is why we report the Atlanta Class I price and premiums in the table below.
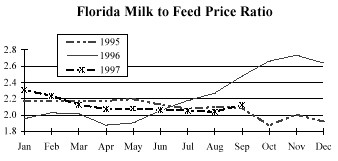 |
The other part of the profitability equation is feed prices. Based on our monthly prices of commodities FOB Gainesville, feed prices for the first nine months of 1997 are 15% higher than they were in 1995. For individual dairies this will vary, depending on how you buy and contract for feed.
So what’s the whole picture? Even with the higher milk prices due to cooperative negotiated premiums, our Florida Milk to Feed Price ratio has been stuck below where it was in 1995 because of the higher feed prices. An increase in milk prices could make things more favorable, but it depends on what feed costs do.
 |
In short, if you found 1995 year end margins slim and found 1996 better, expect 1997 to be back to the tight margins experienced in 1995.
-Michael DeLorenzo
Class I Milk Prices and Net Premiums* |
||||||
Sep 97 |
Oct 97 |
Nov 97 |
||||
| Location | Class I |
Premium |
Class I |
Premium |
Class I |
Premium |
| Atlanta | 14.99 |
1.05 |
16.35 |
1.20 |
17.07 |
1.20 |
| Up. FL | 16.80 |
2.36 |
17.76 |
2.11 |
18.48 |
2.11 |
| Tampa | 17.50 |
2.76 |
18.46 |
2.51 |
19.18 |
2.51 |
| Miami | 18.20 |
3.16 |
19.16 |
2.91 |
19.88 |
2.91 |
*
Announced
Milk Price Forecasts for 1998
We all know how inaccurate the experts can be when forecasting milk price, but here is what is in print.
USDA: $0.15 lower in 1998 than 1997, with the BFP averaging $12.10. Not expecting apreciable increase in production and favorable future demand with inflation in check and an economy growing at 2.5%.
Missouri: $0.25 - $0.50 higher due to tight milk supplies and a slight rebound in consumption.
Are You Getting the Most Bull for Your Buck?
Recent studies confirm that A.I. young sires are better than the average proven bull, but only by a small margin. Researchers at Virginia Tech University summarized all A.I. young sires progeny tested in the U.S. and found that the young sires, after receiving their first-crop daughter proofs, ranked at the 57th percentile relative to the proven bulls that were available when the young sires were sampled. This means that dairy producers using only average proven bulls could be making faster genetic progress by using all young sires. But how do the young sires compare to the top-end proven bulls? Let’s do a genetic and economic comparison.
Based on the Virginia Tech results, we’ll assume that an average young sire is of similar genetic merit to a proven bull at the 60th percentile. For February 1997, the 60th percentile for Net Merit was $135. We expect the young sires, after they get their daughter proofs in the year 2000, to average about $135 for Net Merit. Half will be higher, half will be lower; we just don’t know with much certainty which ones. That’s why we have to progeny test.
Alternatively, a producer could use top-end proven bulls. For our example, let’s consider the six proven bulls from the February 1997 USDA sire evaluation. These six proven bulls average $212 for Net Merit, which places them in the 98th percentile for Net Merit among the 643 Active A.I. Holstein bulls in the U.S.
Although young sires may be better in genetic merit than the average proven bull, as a group, the young sires still lag behind the top-end proven bulls. Breeders using 100 percent A.I. young sires are not maximizing their herd’s genetic potential, as the superior genetics available from top-end proven bulls are not being incorporated into their herds.
What about semen price?
Young sires almost always have an advantage over proven bulls when it comes to semen price. Semen prices for young sires are often $5 or less per unit. Additionally, herd owners participating in programs may receive credits for calving ease information and credits if the owner has one of the first milking daughters of the bull.
One way to compare young sires with proven bulls, taking into account genetic merit, semen price, and incentive payments, is to calculate a rather simple index called Net Merit Semen Value Index. Net Merit Semen Value Index ranks bulls for lifetime income potential and is calculated as follows:
Net Merit Semen Value Index = (3 x Net Merit) - (6 x semen price).
The multiplication factor of three for Net Merit assumes a daughter will stay in the herd for three lactations. This corresponds to a 33 percent cull rate. The multiplication factor of six for semen price assumes that it takes approximately six units of semen to get a milking daughter in a well managed herd and the semen is used judiciously to get pregnancies. In reality, young sire semen is often used on difficult breeding cows or in the summer months when conception rates are lower. Assuming six units per daughter is probably too generous for the young sire, but if no adjustment is made for incentives, a value of six comes close to approximating overall income and expense.
This index was calculated for the sample of bulls above. Average semen price for the young sires was assumed to be $4. The average semen price for the proven bulls was $22. The lifetime income potential, after accounting for extra semen costs, is still over $120 to the advantage of the proven bulls compared to average young sires.
There are other advantages proven bulls have over young sires:
Proven bulls provide a greater opportunity to use known calving ease bulls on heifers if calving difficulty is a management concern in the herd.
Fertility rankings are available for most proven bulls, so high fertility proven bulls may be logical choices for hard breeding cows or during summer heat stress.
Type proofs on proven bulls are useful for breeders using mating programs.
The bottom line
Young sires continue to be a good value relative to the average proven bull, but as a group, the young sires are not as high in genetic merit as the best proven bulls. Because the best proven bulls are more expensive than young sires, consider calculating a Net Merit Semen Value index to determine best overall value. You may be surprised to see that many of the more expensive bulls still provide the best overall value for your breeding dollar.
Adapted from Dr. Dennis Funk, ABS International
No Federal Orders?
A recent article reviewed the results of three studies on the likely impacts in different parts of the US if we lost the Federal Milk Marketing Orders. Below is the average milk price change from the three studies for the five regions used.
| Region | Estimates price change |
| Northwest | + $0.22 |
| Upper Midwest | + $0.34 |
| Middle Atlantic | - $0.40 |
| Southeast | - $1.03 |
| Southwest | - $0.44 |
Benchmarks - What are they and who should use them?
Every important journey needs a guide and some measure of progress
toward the destination. Would you travel 3000 miles without getting needed information?
Would you journey in new territory without checking that you were on the correct route?
Remember Sacajawea, the Shoshone Indian woman guide that led Lewis and Clark up the
Missouri River in 1803 - 06 to find the overland passage to the Pacific Coast across land
no white man had traveled before? The Lewis and Clark expedition had money, soldiers, the
latest technology, firearms, medicine, compasses, sextants, the best scouts and science of
the times, and a letter from President Thomas
Jefferson granting the expedition protection. They would likely have perished, however, if
a very unusual Indian woman called Sacajawea had not been their guide. She showed them the
way and taught them survival skills for that part of the wilderness. She had knowledge,
skills, and abilities possessed by no one else. What's more, she had lived where Lewis and
Clark planned to travel.
Similarly, guidance and markers of progress are needed on today's growing dairy farms. And, yes, our herds are growing despite or because of the economic situation we are experiencing. Of the nearly 10,000 herds in the Raleigh Dairy Records Processing Center, most larger herds grew in cow numbers this year (Raleigh DRPC services herds from New England south to Florida and west to Colorado). Only those under 100 cows were shrinking in cow numbers (-2%). Herds larger than 300 cows represent only 5% of these 10,000 herds yet sell 24% of the milk. Today's dairy farms are becoming so complex that many special guidance systems are needed.
First, how can one become a more successful dairy producer? Who can be
the guide? A fast way is to learn from the behavior of a successful dairy producer you
know. Find out how he (she) thinks, what he feels, how he sees things, where he gets his
insight and information, what wisdom he
possesses, how he stays out front, and, most of all, what skills, abilities, and knowledge
he uses. These are not easy to discover in a visit, because it took many years for the
successful producer to discover and fine-tune these aptitudes. Many of these insights are
subconscious and hard for the
producer to convert to words. No books can lay out the many steps taken on unique farms in
unique environments that lead to success.
Becoming a successful producer takes more than knowledge, it takes skills and abilities acquired through practice. Since there are few apprenticeships where one can learn from a successful producer for several years, and you don't have years to practice, what are the alternatives? Instead of an apprenticeship, work with the same advisors that the successful dairy producer employs, and set the same standards of performance. The veterinarian, nutritionist, lawyer, accountant, breeder, fieldman, lender, mentor, sale representatives, etc. all have insight into something unique that each successful producer does. These people see all variations in management and know what works on other farms and what doesn't. Let these people be your guide. Use these people collectively on your individual advisory team. Next, set the same benchmarks that a successful producer would use. Benchmarks are performance standards by which something can be measured or judged. Remember the marks on the door with dates and names where your height was recorded as you grew up?
These are benchmarks. They tell where you have been and how much progress you are making over time. Dairy farm benchmark examples include number of cows milking, cost to produce a hundred weight of milk, pounds of milk per worker, tons of milk sold per day, dry matter intake per cow, feed cost to produce CWT., return on investment, % utilization of milking facilities, and so on. These become your measure of progress toward your destination. Next, set new goals for future benchmarks.
In the event that you don't measure up to the benchmarks of the most
successful producer, then figure out why. Go talk with them. Most producers are flattered
to be asked to give advice and generally give it willingly. After all, much of what they
know they learned from someone else. Simply put, determine who is successful in your eyes,
figure out what makes them so, measure the same benchmarks, and see if you measure up. If
not, find out why not and take
action. The two most important steps are to set benchmarks and take action.
Without action, you have no control, and you don’t change. In general, herd averages increase 200 to 400 lbs./yr. and herd sizes increase 3 to 7% in larger herds. Today, if nothing changes, the farm falls behind the progress others are making. If your farm is not changing, it is really going backwards, and that is something you have the ability to change. Take action. Consider what an advisory team could do for your business.
Adapted from C. William Heald, Penn State University.
Florida Dairy Extension
| Andy Andreasen - Jackson Co. | Wayne Odegaard - Hernando Co. |
| David Bray - Dairy & Poultry Sci. | Travis Seawright - Manatee Co. |
| Michael DeLorenzo - Dairy & Poultry Sci. | David Shannon - Calhoun Co. |
| Roger Elliott - Escambia Co. | David Solger - Washington Co. |
| Shepard Eubanks - Holmes Co. | Mary Sowerby - Multi-county |
| Russ Giesy - Multi-county | Charles Staples - Dairy & Poultry Sci. |
| Mary Beth Hall - Dairy & Poultry Sci. | Robert Tervola - Suwannee Co. |
| Larry Halsey - Jefferson Co. | Paulette Tomlinson - Columbia Co. |
| Pat Hogue - Highlands Co. | James Umphrey - Dairy & Poultry Sci. |
| Patrick Joyce - Duval Co. | Jack Van Horn - Dairy & Poultry Sci. |
| Elzy Lord - Alachua Co. | Chris Vann - Lafayette Co. |
| Pat Miller - Okeechobee Co. | Marvin Weaver - Gilchrist Co. |
| Roger Natzke - Dairy & Poultry Sci. | Dan Webb - Dairy & Poultry Sci. |